Straight through Ethernet cabling (cable entering from bottom, pins up, clip down)
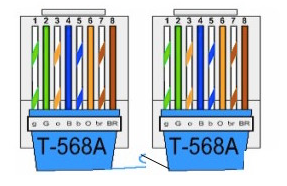
Cross over cable (cable entering from bottom, pins up, clip down)
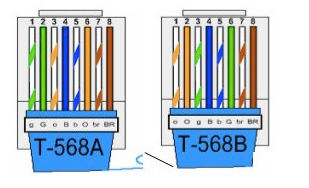

Straight through Ethernet cabling (cable entering from bottom, pins up, clip down)
Cross over cable (cable entering from bottom, pins up, clip down)
Updated 2025/03/12 – Additional migration configuration
In my previous post How to Build a ProxMox Hypervisor Cluster with NAS Disk I described the configuration of QNAP NAS iSCSI LUNs to support ProxMox hypervisor servers with the goal of highly available high performance disk. In this post I will outline the configuration of VMs within the ProxMox cluster to gain disk replication across specific hypervisor hosts. Replication is a pretty slick and painless way to provide (higher) availability of VMs both for maintenance activities as well as host node failures without the complexity of full HA Cluster configuration. I do have pretty substantial experience with Linux Virtual Sever (LVS) and commercial clustering solutions, so I will likely address the ProxMox version of that capability in a future article.
To recap from my previous article, each of the three (3) ProxMox hosts has a pair of mirrored HDD, which are only used for ProxMox OS. Each host also has a single SSD for the occasional IOPs hungry VM. Although single local disk does present a failure risk, at this point in my network design, that is a deliberate choice. Any VM that cannot tolerate that single point of failure is required to use the iSCSI zpool. Also the goal at this point is not to go overboard on elimination of every single point of failure, just the highest probabilities. At this point there are three (3) different hosts, three (3) separate UPS, all using multiple network adapters for performance management. QNAP NAS iSCSI volumes are used for disk redundancy.
Adding replication to any of my ProxMox VMs is made straight forward by a couple of design choices. Every ProxMox host has the same ZFS zpool storage groups which are all named the same across each host – currently two: zfs-ssd1 (local SSD on each host) and zfs-iscsi1 (QNAP NAS served iSCSI LUNs dedicated to each host). Technically VMs could use the local ZFS rpool, however I’ve chosen to keep VM disks completely separate from local ProxMox OS storage.
Generally the entire process involves three simple steps: Create VM, Configure Replication, Request Migration.
We can create the guest VMs as usual, but must specify virtual disk volumes within the zfs-ssd1, zfs-iscsi1, or both ZFS storage pools.
Use host > zfs-ssd1 > Summary and host > zfs-iscsi1 > Summary pages in the UI to determine capacity left on each host. As you would expect, allocation of space for a VM needs to take place on all hosts on which that VM is desired to be replicated. Replicating a VM to all hosts will take 3x the storage allocation versus having no replication.
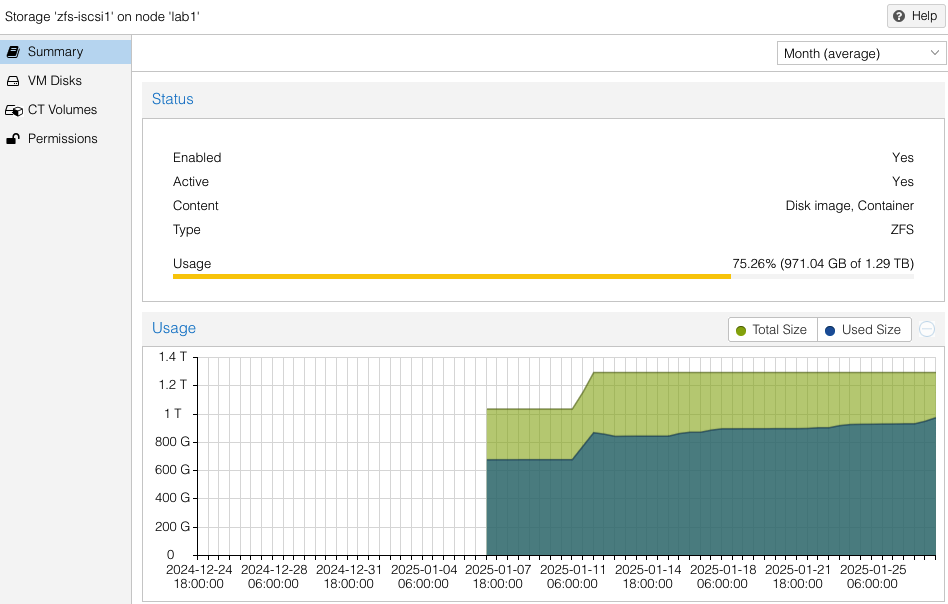
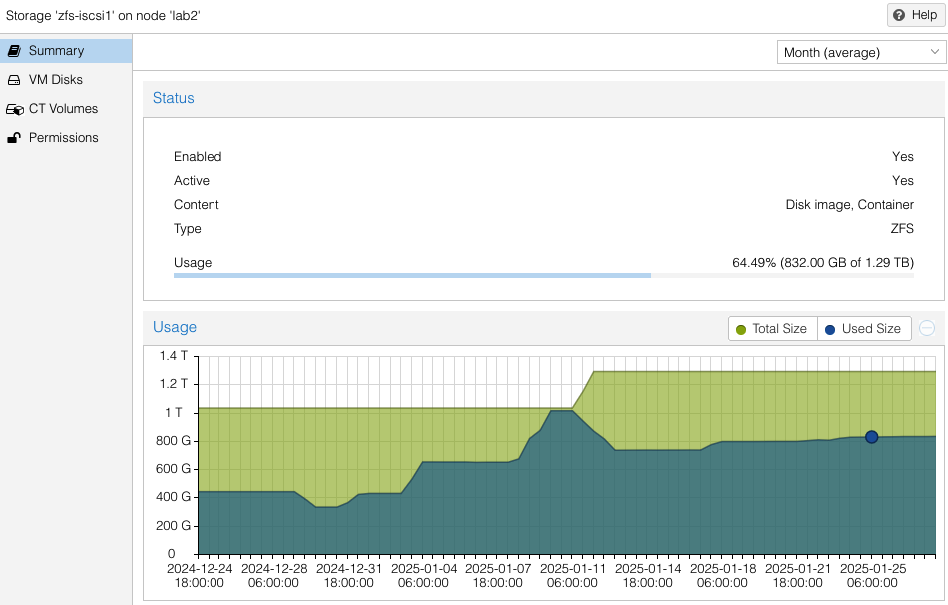
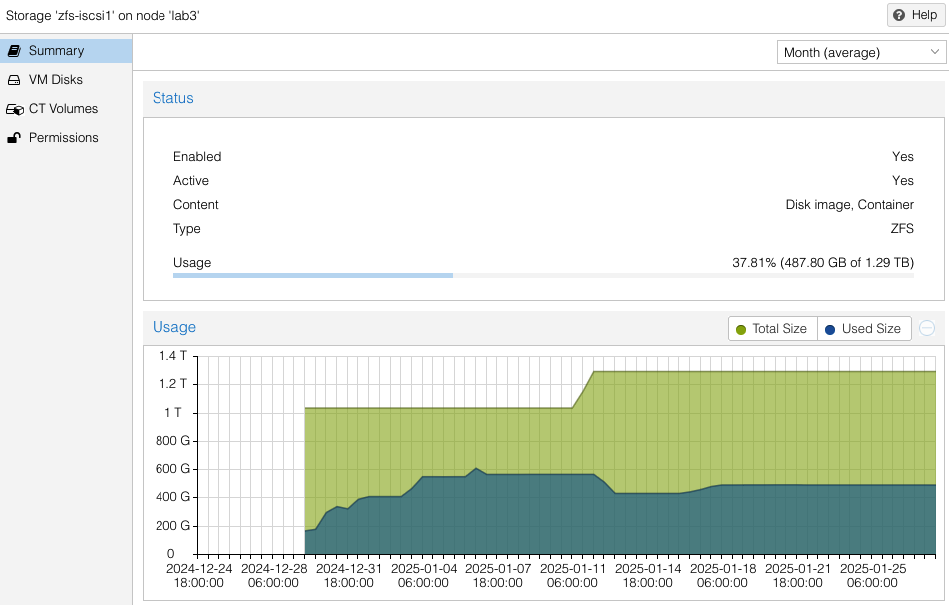
Note the availability and allocation of iSCSI storage on each of the three (3) ProxMox hosts. Might seem like lab2 was setup first, then lab3, then lab1. Actually both lab3 and lab1 were rebuilt after the initial three (3) node cluster was built. No loss of VMs occurred since I had all VMs replicated to the surviving cluster nodes while I did a rolling rebuild – there was always at least two cluster hosts. Also you can see at the beginning of January (01-11) zfs-iscsi1 pool was running out of space to allocate to either VMs or replication. I simply added another 250GB iSCSI LUN from the QNAP and extended the zfs-iscsi1 pool. More on that later.
VM Example – Replication to One Host
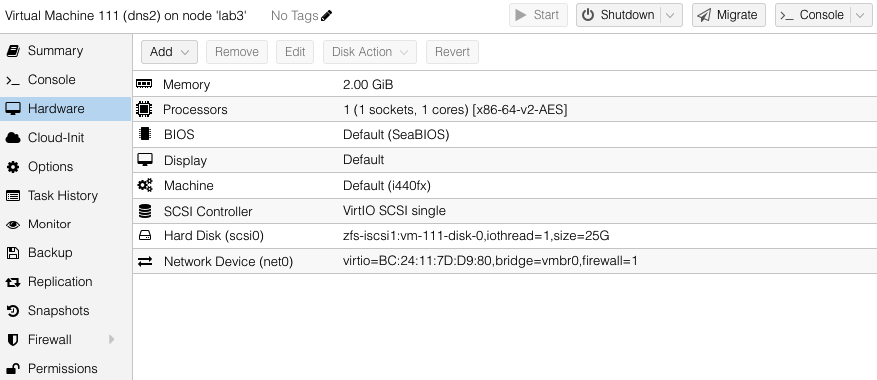
Our first VM will have multiple virtual disks located in the zfs-iscsi1 pool. These are all in the zfs-iscsi1 pool, however it could just as easy have a mix of zfs-iscsi1 and zfs-ssd1 virtual disks – presuming there is sufficient space available in the target host pools to which we intend to replicate. There is no restriction of number of pools used by the VM, just as long as those pool names are available on the target host.
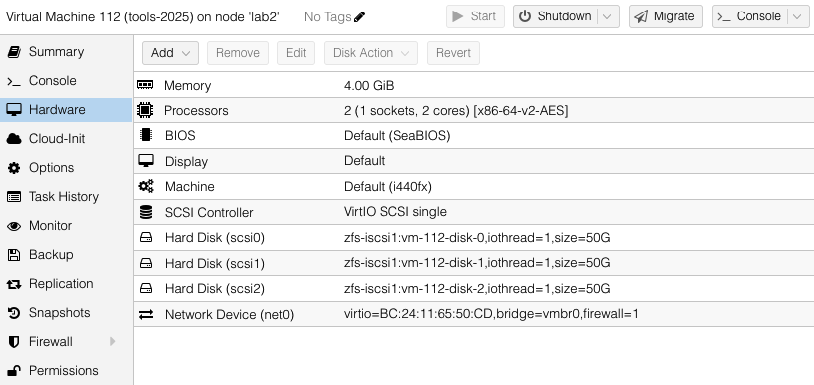
We will configure the tools-2025 VM to replicate to one other host – lab1.
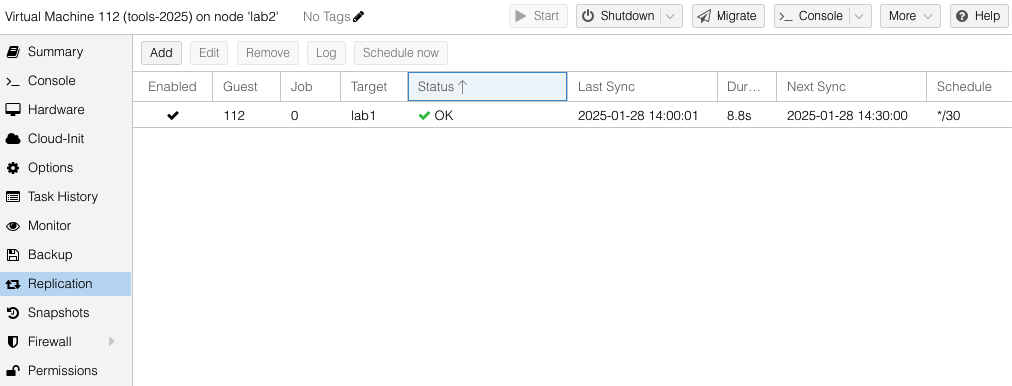
While creating the replication job, dialog boxes are used to select destination host(s) and the frequency of the replication. Sync jobs are run by taking zpool snapshots and sending those snapshots to the target host. Typical cadence would be every 15 minutes for sync of important VMs. Offline or less important VMs can sync hourly, nightly or even monthly – similar options as what you would find with Linux crontab jobs. Shortly after you have created the replication job, ProxMox will get it running in the background.
Difference Between Replicate and Migrate
Replication jobs run on a regular basis to push ZFS snapshots to the target hosts. When a migration of VM from one host to another is requested – literally a button push – the replication will speed the migration through the use of snapshots that are already on the target host. It is not necessary to have replication jobs enabled in order to migrate a VM, however it will take longer to migrate the more disk data that has to be synchronized. When migrating VMs with a large amount of storage that has not been replicated, it can take a very long time to run and possibly not successfully complete in the case of attempting live migrations. More on this in the next example.
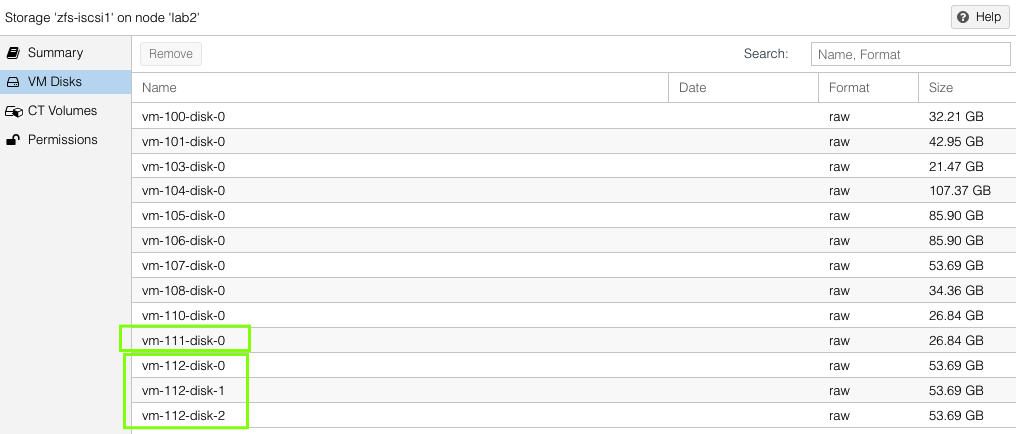
On each host, one can see the VM virtual disks that have been replicated by looking at host > ZFS pool name > VM Disks. This list will be the same on both the source and the target hosts.
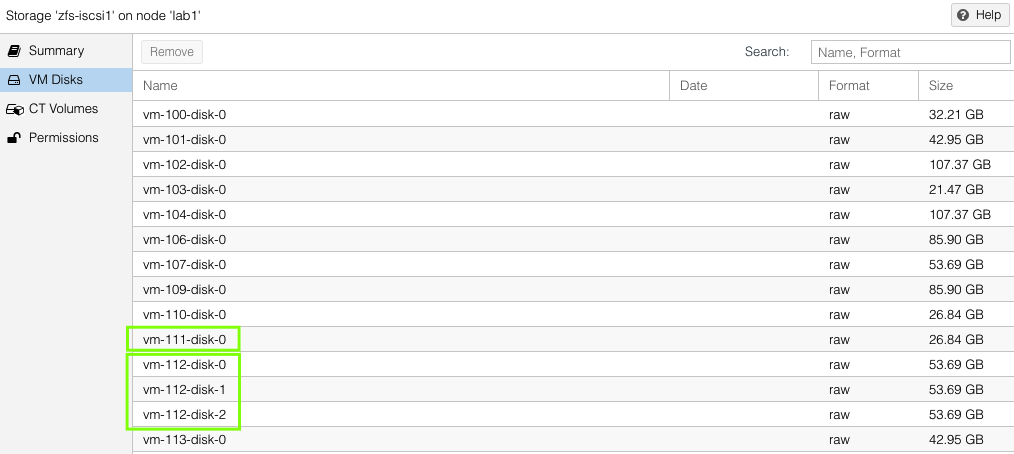
VM Example – Replication to Two Hosts
Our second VM will have a single virtual disks located in the zfs-iscsi1 pool but is going to replicate to both of the other standby ProxMox hosts.
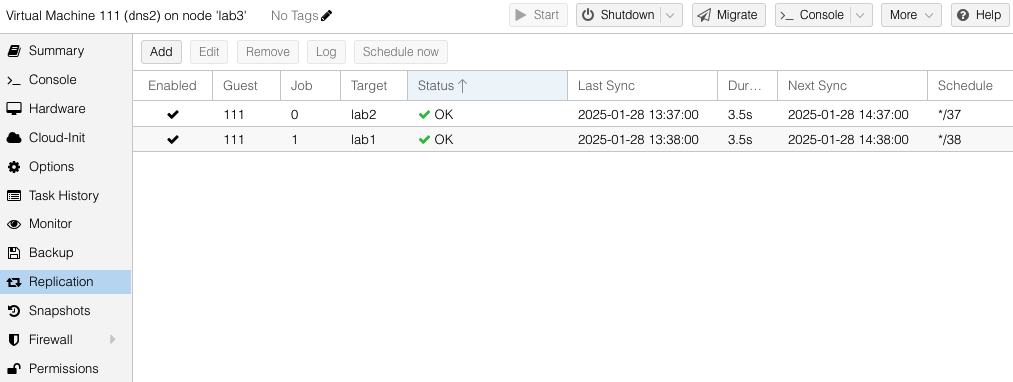
You can see both the replication jobs configured for VM 111, one to lab1 and the other to lab2. The replication job frequency is completely flexible however I have chosen to offset the schedules to reduce the disk use bandwidth.
Migrations can be either offline (VM powered off) or live. To request a migration, we just select the Migrate button under the VM to be moved. Live migrations are just that – it replicates then moves a running VM to a target host with no perceived downtime.
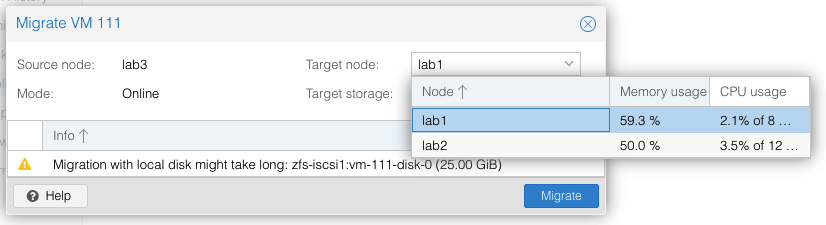
The migrate menu will show you the current CPU and memory load of the available target systems. Fastest migrations are offline VMs that have had a recent replication job complete. Large VMs with lots of disk and memory and no prior replication have been known to fail to migrate – it is complicated to snapshot live memory for synchronization to a target host. All but the largest of VMs I have (looking at you elasticsearch) have no problems in migrating live in less than maybe 30 seconds for 4GB of memory.
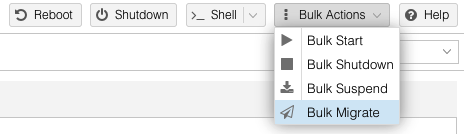
In the case there is sufficient CPU and memory capacity on the target host, one can request a Bulk Migration operation from the main menu of the source host. I have used this several times to perform maintenance on cluster hosts where downtime is needed. The live migration of VMs is amazing .. makes life so much easier, with no VM reboot or downtime.
The scenarios I have outlined so far are most common, however one of the key use cases I wanted to be able to cover is what happens when a ProxMox host unexpected fails.
Fortunately a surviving host can start the failed VMs from last transferred snapshot. Clearly any data that was changed after the last replication snapshot will be lost. Not great for any VMs that are hosting applications / functions that are frequently changing, such as database servers. This ability is still sufficient for my use case and situation – low chance of host failure causing total data corruption (still not zero but far better than what I had before). A future article will focus on use of HA Cluster features including global cluster filesystems to cover those systems I have that have high(er) integrity requirements.
For example purposes, assume a three (3) node ProxMox hypervisor cluster without HA as I’ve described above. Two ZFS disk pools, zfs-ssd1 and zfs-iscsi1. We’ll reference six (6) guest VMs that have been created and configured to be using disk volumes within the zfs-iscsi1 pool. Currently two (2) VM are on each ProxMox host. Replication jobs have been configured on all VM to replicate every 15 minutes to both other ProxMox hosts. VMs on lab1 are vm-1 and vm-2. VMs on lab2 are vm-3 and vm-4. VMs on lab3 are vm-111 and vm-112. In this case assume lab3 has suddenly failed and is completely offline/powered off. The following process will allow a restart of vm-111 and vm-112 on either lab1 or lab2. For simplicity let’s restart vm-111 on lab1 and vm-112 on lab2.
Verify Replication
We need to confirm that the replication data for vm-111 and vm-112 exists on lab1 and lab2:
lab1:
  zfs list | grep "vm-111"

zfs-iscsi1/vm-111-disk-0 28.2G 323G 2.81G -
lab2:
  zfs list | egrep vm-112

zfs-iscsi1/vm-112-disk-0 83.9G 348G 33.1G -
zfs-iscsi1/vm-112-disk-1 71.5G 348G 20.7G -
zfs-iscsi1/vm-112-disk-2 55.2G 348G 4.42G -
Since we see datasets zfs-iscsi1/vm-111-disk-0 and zfs-iscsi1/vm-112-disk-0, the replication data appears to be intact.
Import the VM Configuration
Each VM has a configuration file in /etc/pve/qemu-server/ on the Proxmox cluster.
Check if the config files for vm-111 are on lab1 and vm-112 are present on lab2:
  lab1# ls /etc/pve/qemu-server

100.conf  101.conf  102.conf  103.conf	111.conf  113.conf
lab2# ls /etc/pve/qemu-server
100.conf 112.conf 118.confSince the config files exist, we can proceed to the next step. If those files do not exist, move the configuration files manually from the lab3 replicated configuration. ProxMox uses cluster filesystem for /etc/pve directory so those files should be in the /etc/pve/qemu-server/lab3 directory.
 lab1# cd /etc/pve
 lab1# mv nodes/lab3/qemu-server/111.conf qemu-server/
Next we need to verify manual adjustment of VM configuration not needed. Ensure the disk paths in the configuration files match the replicated ZFS datasets on the new host. Since our design uses the same ZFS zpool names on all ProxMox hosts, should not need to change the paths which will look like:
scsi0: zfs-iscsi1:vm-105-disk-0
Start the VMs
Once the configuration is correct, start the VMs on either lab1 or lab2.
On lab1, start vm-111:
qm start 111On lab2:
qm start 112Verify VM Status
Check the status of the VMs to ensure they are running:
  qm status 111

status: running

  qm status 112

status: running
Optional: Migrate VMs for Balance
If needed those VMs can now be migrated live. To migrate vm-111 to lab2:
qm migrate 111 lab2 --onlineRemember there may not be a valid zpool snapshot for vm-111 on lab2, so it may take some time. I’ll expand on this failure recovery procedure in a future article.
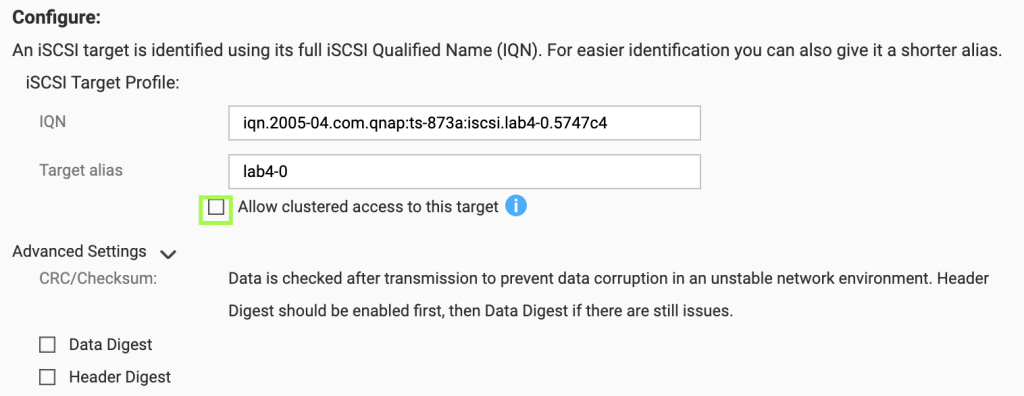
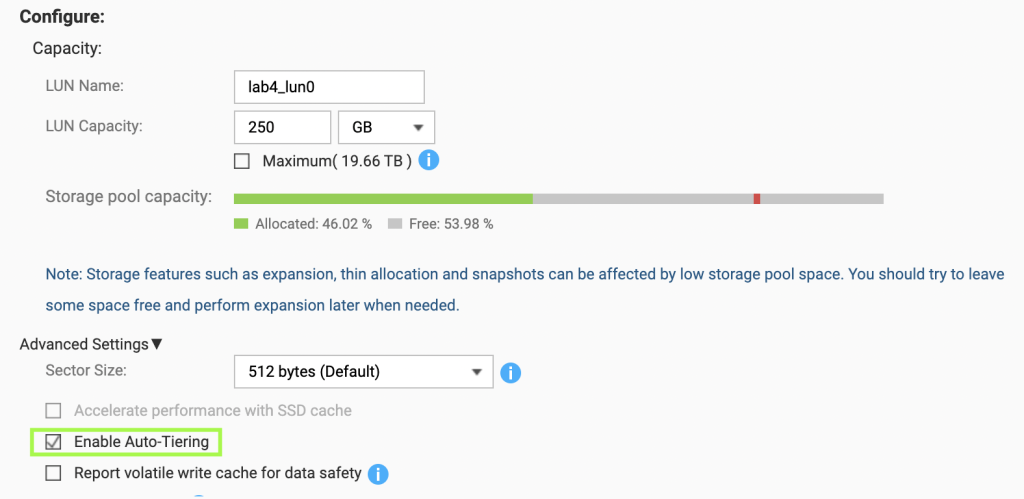
When I needed to expand the space available in zfs-iscsi1 on lab2, the process was pretty straight forward. Follow the same instructions in my first article to create a new iSCSI target and 250GB LUN for each host in the cluster. For instance, I created lab1_lun4, lab2_lun4, and lab3_lun4. Use the iscsiadm commands for discovery against the QNAP NAS network interface that each lab cluster node is using. Follow same iscsiadm, lsblk and sgdisk commands to locate and label the new disk and enable auto login.
Extend the existing zfs-iscsi1 zpool with zpool add command. Use the newly added disk name as shown by lsblk, in this example /dev/sdh is the newly added disk:
 zpool add zfs-iscsi1 /dev/sdh
 zpool list

NAME       SIZE  ALLOC   FREE  ...   FRAG    CAP  DEDUP    HEALTH
rpool      928G  4.44G   924G          0%     0%  1.00x    ONLINE
zfs-ssd1   476G   109G   367G          1%    22%  1.00x    ONLINE
zfs-iscsi1 1.21T  183G   1.03T         5%    14%  1.00x    ONLINE
Expanded Architecture Enabling More Replication
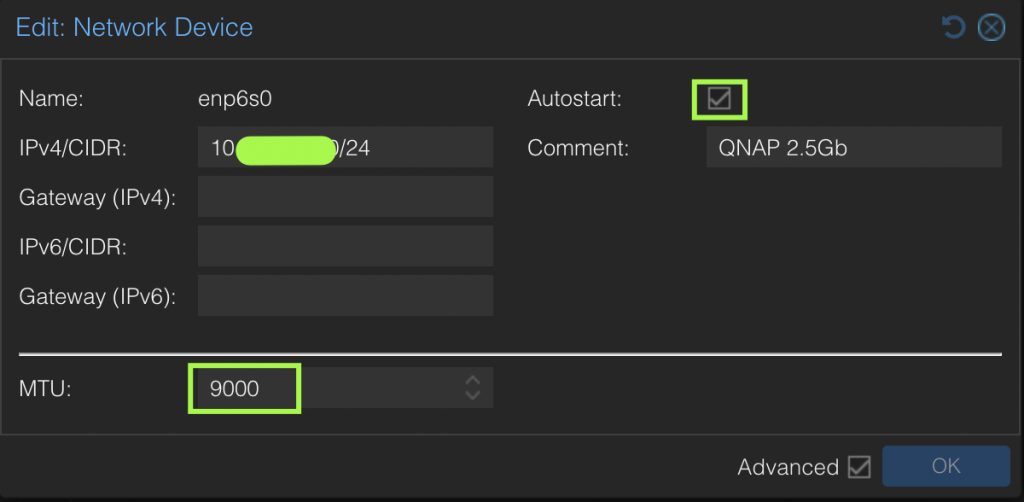
To ensure dedicated high speed access to iSCSI disk LUNs and also to enable replication to multiple hosts, I revised the architecture to include an additional private 2.5Gb network segment dedicated to migration traffic. Using a dedicated 2.5Gb switch
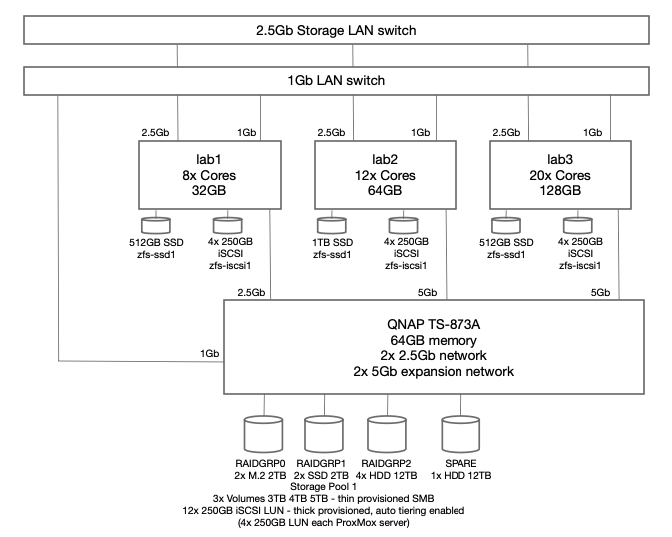
Specific migration configuration settings only apply to the entire cluster including all nodes. Unless otherwise configured, ProxMox will use the primary cluster IP addresses and NICs for migration traffic. Problem is that is typically the production network adapter and could only be 1 Gbs. Since I was using a dedicated NIC for iSCSI access, I decided to use dual NIC cards and use a dedicated 2.5Gb network segment for migration traffic, while the other NIC is dedicated to iSCSI traffic via a unique IPv4 subnet for each server connection to the QNAP server.
ProxMox documentation Migrate Configuration for Cluster
Migration configuration is located in /etc/pve/datacenter.cfg and has this syntax:
migration: [type=]<secure|insecure> [,network=<CIDR>]Migration traffic is encrypted using an SSH tunnel by default. On secure, completely private networks this can be disabled to increase performance.
migration: type=insecure,network=10.3.11.0/24Once the datacenter.cfg file has been updated, shortly (usually less than 30 seconds) ProxMox will start using the new network for migration traffic. Watching the migration progress dialog box we can see that transfer rates are routinely hitting 200MB/s and some peaks at 300MB/s. Bonus all that traffic does not compete with either Production network or iSCSI network traffic.
Next I’ll explore the HA Clustering capabilities of ProxMox.
After struggling to recover a moderately important VM on one of my home lab servers running generic CentOS libvirt, a colleague suggested I investigate ProxMox as a replacement to libvirt since it offers some replication and clustering features. The test was quick and I was very impressed with the features available in the community edition. It took maybe 15-30 minutes to install and get my first VM running. I quickly rolled ProxMox out on my other two lab servers and started experimenting with replication and migration of VMs between the ProxMox cluster nodes.
The recurring pain I was experiencing with VM hosts centered around primarily failed disks, both HDD and SSD, but also a rare processor failure. I had already decided to invest a significant amount of money into a commercial NAS (one of the major failures was irrecoverability of a TrueNAS VM with some archive files). Although investing in a QNAP or Synology NAS device would introduce a single point of failure for all the ProxMox hosts, I decided to start with one and see if later I could justify the cost for a redundant QNAP. More on that in another article.
The current architecture of my lab environment now looks like this:
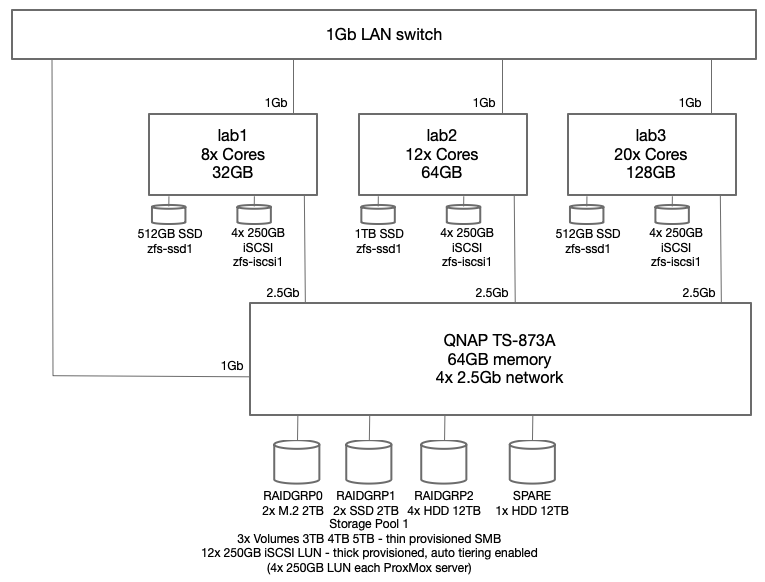
To reduce the complexity, I chose to setup ProxMox for replication of VM guests and allow live migration but not to implement HA clustering yet. To support this configuration, the QNAP NAS device is configured to advertise a number of iSCSI LUNs, each with a dedicated iSCSI target hosted on the QNAP NAS system. Through trial and error testing I decided to configure four (4) 250GB LUNs for each ProxMox host. All four (4) of those LUNs are added into a new ZFS zpool making 1TB of storage available to each ProxMox host. Since this iteration of the design is not going to use shared cluster aware storage, each host has a dedicated 1TB ZFS pool (zfs-iscsi1) however each pool is named the same to facilitate replication from one ProxMox host to another. For higher performance requirements, I also employ a single SSD on each host which have also been placed into a ZFS pool (zfs-ssd1) named the same on each host.
A couple of notes on architecture vulnerabilities. Each ProxMox host should have dual local disks to allow ZRAID1 mirroring. I chose to have only single SSD in each host to start with and tolerate a local disk failure – replication will be running on critical VM to limit the loss in the case of a local SSD failure. Any VM that cannot tolerate any disk failure will only use the iSCSI disks.
Boot into the ProxMox installer
Assuming the new host has dual disks that can be mirrored, chose Advanced for the boot disk and select ZRAID1 – this will allow you to select the two disks to be mirrored
Follow the installation prompts and sign in on the console after the system reboots
Use lsblk to identify local disks attached to find the SSD
 lsblk

sda      8:0    0 931.5G  0 disk
├─sda1   8:1    0  1007K  0 part
├─sda2   8:2    0     1G  0 part
└─sda3   8:3    0 930.5G  0 part
sdb      8:16   0 476.9G  0 disk
sdc      8:32   0 931.5G  0 disk
├─sdc1   8:33   0  1007K  0 part
├─sdc2   8:34   0     1G  0 part
└─sdc3   8:35   0 930.5G  0 part
Clear the disk label if any and create empty GPT
 sgdisk --zap-all /dev/sdb
 sgdisk --clear --mbrtogpt /dev/sdb
Create ZFS pool with the SSD
 zpool create zfs-ssd1 /dev/sdb
 zpool list

NAME       SIZE  ALLOC   FREE  ...   FRAG    CAP  DEDUP    HEALTH
rpool      928G  4.44G   924G          0%     0%  1.00x    ONLINE
zfs-ssd1   476G   109G   367G          1%    22%  1.00x    ONLINE
Update /etc/pve/storage.cfg and ensure ProxMox host is listed as a node for zfs-ssd1 pool. Initial entry can only list the first node. When adding another ProxMox host, the new host gets added to the nodes list.
zfspool: zfs-ssd1
	pool zfs-ssd1
	content images,rootdir
	mountpoint /zfs-ssd1
	nodes lab2,lab1,lab3
Note the /etc/pve files are maintained in a global filesystem and any edits while on one host will reflect on all other ProxMox cluster nodes.
Update /etc/iscsi/iscsid.conf to setup automatic start, CHAP credentials
 cp /etc/iscsi/iscsid.conf /etc/iscsi/iscsid.conf.orig

node.startup = automatic
node.session.auth.authmethod = CHAP
node.session.auth.username = qnapuser
node.session.auth.password = hUXxhsYUvLQAR

 chmod o-rwx /etc/iscsi/iscsid.conf
 systemctl restart iscsid
 systemctl restart open-iscsi
Validate connection to QNAP, ensure no sessions exist do discovery of published iSCSI targets. Ensure to use the high speed interface address of the QNAP.
iscsiadm -m session -P 3
No active sessions
iscsiadm -m discovery -t sendtargets -p 10.3.1.80:3260
10.3.1.80:3260,1 iqn.2005-04.com.qnap:ts-873a:iscsi.lab1-0.5748c4
10.3.5.80:3260,1 iqn.2005-04.com.qnap:ts-873a:iscsi.lab1-0.5748c4
10.3.1.80:3260,1 iqn.2005-04.com.qnap:ts-873a:iscsi.lab1-1.5748c4
10.3.5.80:3260,1 iqn.2005-04.com.qnap:ts-873a:iscsi.lab1-1.5748c4
10.3.1.80:3260,1 iqn.2005-04.com.qnap:ts-873a:iscsi.lab1-2.5748c4
10.3.5.80:3260,1 iqn.2005-04.com.qnap:ts-873a:iscsi.lab1-2.5748c4
10.3.1.80:3260,1 iqn.2005-04.com.qnap:ts-873a:iscsi.lab1-3.5748c4
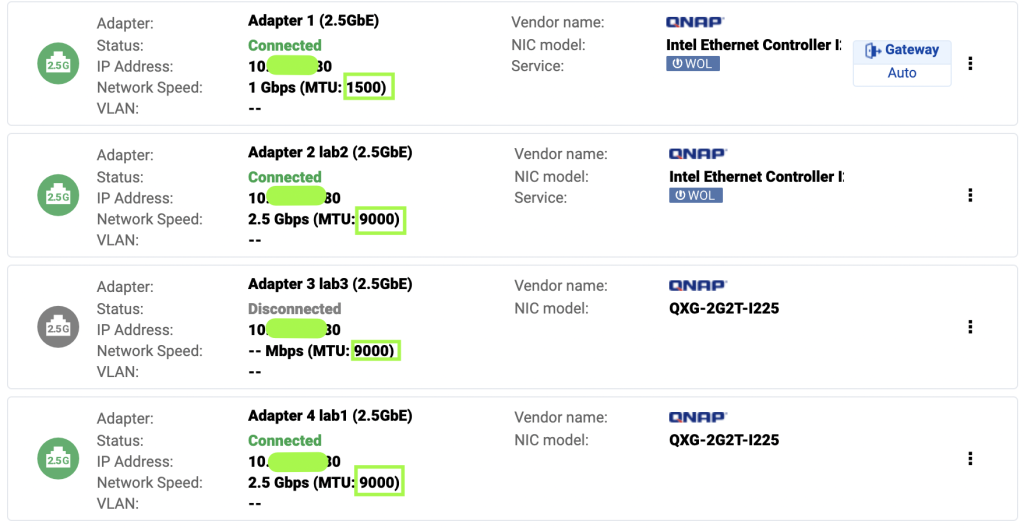
10.3.5.80:3260,1 iqn.2005-04.com.qnap:ts-873a:iscsi.lab1-3.5748c4In the output of the discovery it appears there are two sets of targets. This is due to multiple network adapters under Network Portal on the QNAP being included in the targets. We will use the high speed address (10.3.1.80) for all the iscsiadm commands.
Execute login to each iSCSI target
 iscsiadm -m node -T iqn.2005-04.com.qnap:ts-873a:iscsi.lab1-0.5748c4 -p 10.3.1.80:3260 -l
Logging in to [iface: default, target: iqn.2005-04.com.qnap:ts-873a:iscsi.lab1-0.5748c4, portal: 10.3.1.80,3260]
Login to [iface: default, target: iqn.2005-04.com.qnap:ts-873a:iscsi.lab1-0.5748c4, portal: 10.3.1.80,3260] successful.

 iscsiadm -m node -T iqn.2005-04.com.qnap:ts-873a:iscsi.lab1-1.5748c4 -p 10.3.1.80:3260 -l
Logging in to [iface: default, target: iqn.2005-04.com.qnap:ts-873a:iscsi.lab1-1.5748c4, portal: 10.3.1.80,3260]
Login to [iface: default, target: iqn.2005-04.com.qnap:ts-873a:iscsi.lab1-1.5748c4, portal: 10.3.1.80,3260] successful.

 iscsiadm -m node -T iqn.2005-04.com.qnap:ts-873a:iscsi.lab1-2.5748c4 -p 10.3.1.80:3260 -l
Logging in to [iface: default, target: iqn.2005-04.com.qnap:ts-873a:iscsi.lab1-2.5748c4, portal: 10.3.1.80,3260]
Login to [iface: default, target: iqn.2005-04.com.qnap:ts-873a:iscsi.lab1-2.5748c4, portal: 10.3.1.80,3260] successful.

 iscsiadm -m node -T iqn.2005-04.com.qnap:ts-873a:iscsi.lab1-3.5748c4 -p 10.3.1.80:3260 -l
Logging in to [iface: default, target: iqn.2005-04.com.qnap:ts-873a:iscsi.lab1-3.5748c4, portal: 10.3.1.80,3260]
Login to [iface: default, target: iqn.2005-04.com.qnap:ts-873a:iscsi.lab1-3.5748c4, portal: 10.3.1.80,3260] successful.
Verify iSCSI disks were attached
 lsblk
NAME   MAJ:MIN RM   SIZE RO TYPE MOUNTPOINTS
sda      8:0    0 931.5G  0 disk
├─sda1   8:1    0  1007K  0 part
├─sda2   8:2    0     1G  0 part
└─sda3   8:3    0 930.5G  0 part
sdb      8:16   0 476.9G  0 disk
├─sdb1   8:17   0 476.9G  0 part
└─sdb9   8:25   0     8M  0 part
sdc      8:32   0 931.5G  0 disk
├─sdc1   8:33   0  1007K  0 part
├─sdc2   8:34   0     1G  0 part
└─sdc3   8:35   0 930.5G  0 part
sdd      8:48   0   250G  0 disk
sde      8:64   0   250G  0 disk
sdf      8:80   0   250G  0 disk
sdg      8:96   0   250G  0 disk
Create GPT label on new disks
 sgdisk --zap-all /dev/sdd
 sgdisk --clear --mbrtogpt /dev/sdd
 sgdisk --zap-all /dev/sde
 sgdisk --clear --mbrtogpt /dev/sde
 sgdisk --zap-all /dev/sdf
 sgdisk --clear --mbrtogpt /dev/sdf
 sgdisk --zap-all /dev/sdg
 sgdisk --clear --mbrtogpt /dev/sdg
Create ZFS pool for iSCSI disks
 zpool create zfs-iscsi1 /dev/sdd /dev/sde /dev/sdf /dev/sdg
 zpool list

NAME       SIZE  ALLOC   FREE  ...   FRAG    CAP  DEDUP    HEALTH
rpool      928G  4.44G   924G          0%     0%  1.00x    ONLINE
zfs-ssd1   476G   109G   367G          1%    22%  1.00x    ONLINE
zfs-iscsi1 992G   113G   879G          0%    11%  1.00x    ONLINE
Setup automatic login on boot for iSCSI disks
 iscsiadm -m node -T iqn.2005-04.com.qnap:ts-873a:iscsi.lab1-0.5748c4 -p 10.3.1.80 -o update -n node.startup -v automatic

 iscsiadm -m node -T iqn.2005-04.com.qnap:ts-873a:iscsi.lab1-1.5748c4 -p 10.3.1.80 -o update -n node.startup -v automatic

 iscsiadm -m node -T iqn.2005-04.com.qnap:ts-873a:iscsi.lab1-2.5748c4 -p 10.3.1.80 -o update -n node.startup -v automatic

 iscsiadm -m node -T iqn.2005-04.com.qnap:ts-873a:iscsi.lab1-3.5748c4 -p 10.3.1.80 -o update -n node.startup -v automatic
Update /etc/pve/storage.cfg for the zfs-iscsi1 ZFS pool to show up in the ProxMox GUI. Initial entry can only list the first node. When adding another ProxMox host, the new host gets added to the nodes list.
zfspool: zfs-iscsi1
	pool zfs-iscsi1
	content images,rootdir
	mountpoint /zfs-iscsi1
	nodes lab2,lab1,lab3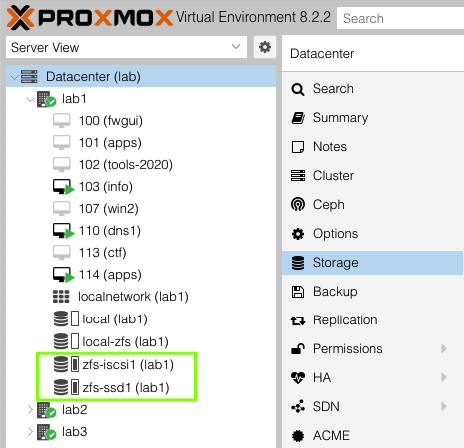
Next I will cover the configuration of VM for disk replication across one or more ProxMox hosts in this article How to Configure ProxMox VMs for Replication
Updated 2025/03/04
To complement the Raspberry Pi based Garden Controller I’ve designed and built, I decided to separate the irrigation valve and pump control onto a separate project and circuit board in order to make it more generically applicable. My intent is to make this Power Controller useful for any designer that has a computer capable of I2C communication.
Since this new Power Controller will be a generic controller that uses I2C communication, provides 24VAC for irrigation valves and also control of external power relays for two pumps, it needs to provide all it’s own power versus only relying on a 3.3v feed from the I2C host. I decided this will be the initial feature set:
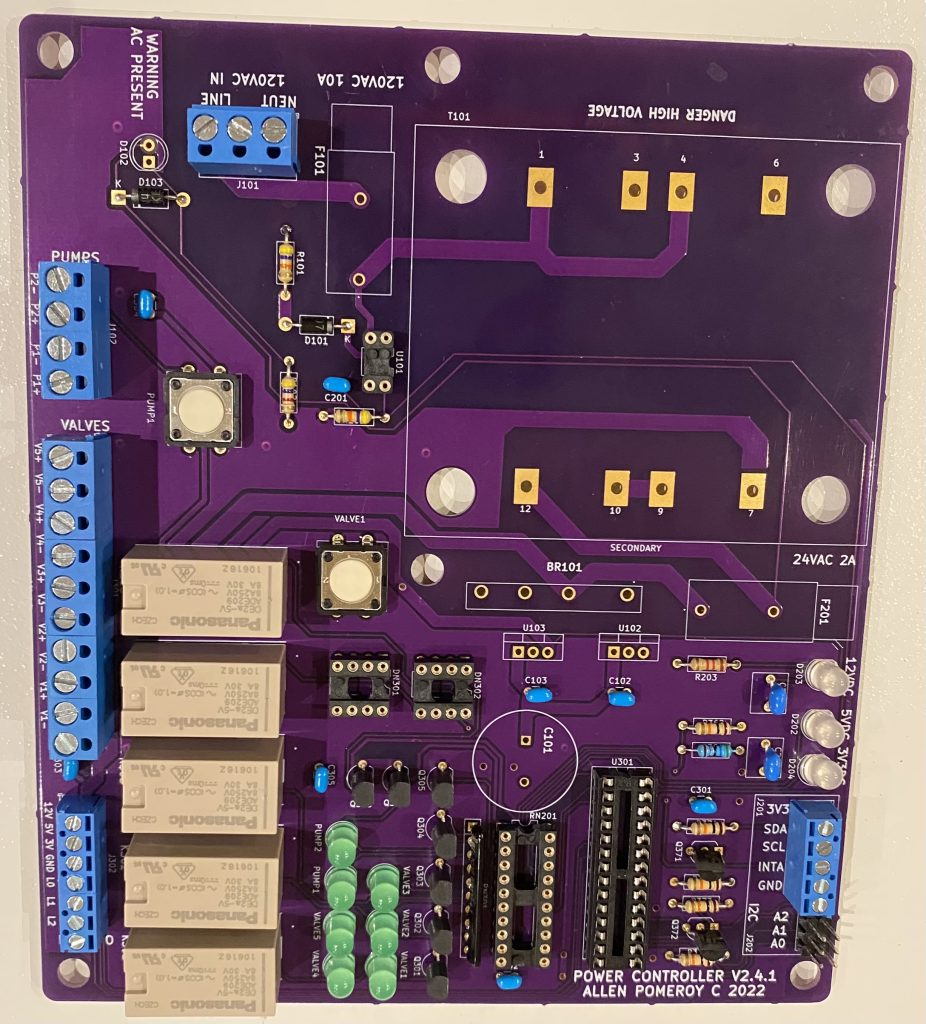
3D PCB View
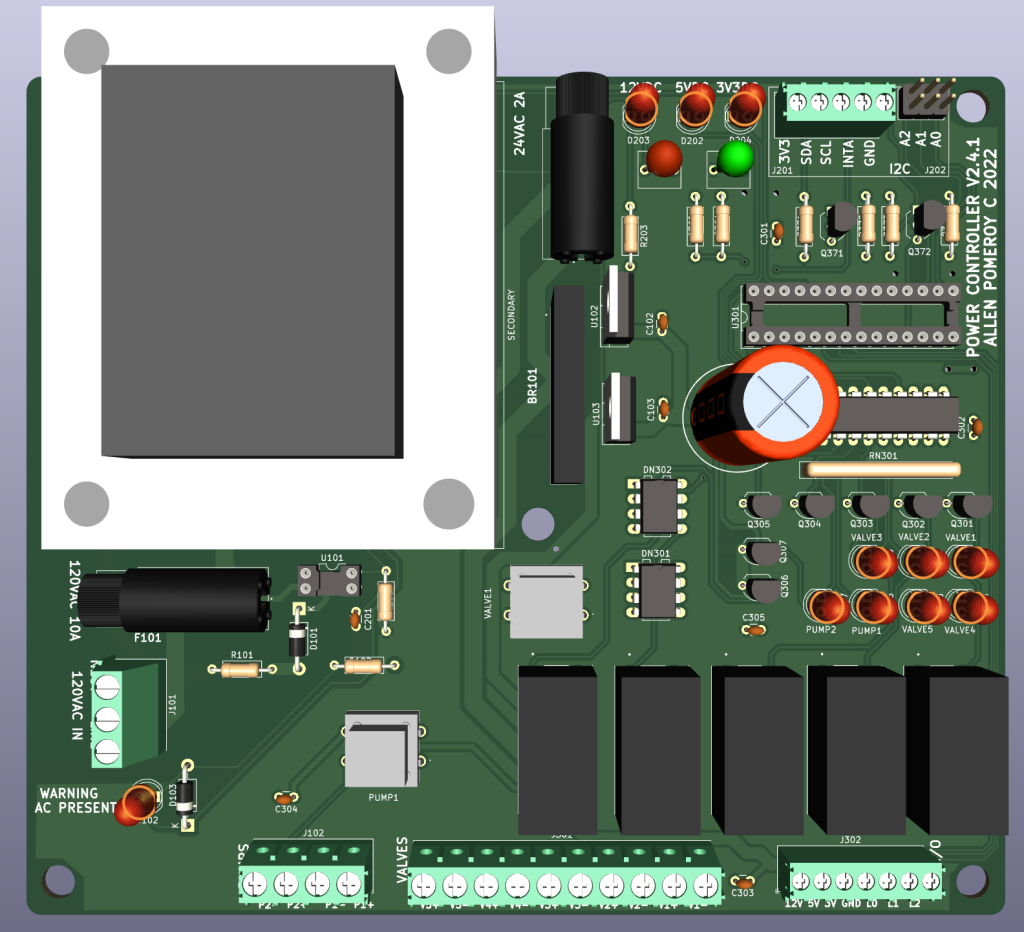
Design and Prototype
I used Kicad schematic and PCB design tools to begin building a dedicated power controller board. There is a trade off between having all of the switching and power functions on a single board versus moving the 120VAC switching off board to dedicated power relays. Given the possible high VAC current requirement for switching pumps, I found using the external relays allowed me to substantially reduce the PCB size and width of traces. At the same time, using a transformer that could supply 24VAC directly to the commercial irrigation valves would enable a compact design with minimal external components to the controller board. To offer maximum flexibility, I chose to add the ability to use a small number of the GPIO lines for either input or output along with a modest amount of external 3.3v, 5v and 12v power. The GPIO controller I chose was the MCP230017 which includes a built in I2C interface and two banks of 8 individually addressable I/O lines.
Due to the best valve relay choice and the fact that most of the external sensors I wanted to use, I chose to drive the MCP23017 at 5v although seems possible to also drive at 3.3v. For I2C and interrupt line to host interfaces I included 3.3v – 5v level converters since the Raspberry Pi I2C uses 3.3v levels.

For each of the relays we don’t need more than 40 mA so simple NPN 2N2222 transistors can be used to switch the relay coil voltage. Despite opting to use through-hole components versus surface mount so this board is easier to make for any hobbyists who use this design, I did want to reduce the component count and footprint where possible. Two areas include any pull-up or limiting resistors and all the kick-back diodes on all the switching transistors. DIP and SIP packages reduce both component count and board real estate.
Power Supply Design
Since the Power Controller needs to provide power for the irrigation valves and external pump control relays, I started with the valve requirements. Need to have 24VAC available to drive up to five (5) valves. I chose to use professional grade RainBird LVF075 Low Flow valves since I want reliable operation given the extensive irrigation I’m choosing to install. Given the in-rush and holding current required for each valve, the Hammond 183K24 transformer will suit given it’s 56VA maximum power factor.
Power Supply Specifications
Output (Internal)
5VDC 400mA max
.. each relay 40mA .. 200mA all on x 5 VDC = 1W
.. 200 mA max external supply = 2W
Output (External)
5x 24VAC 1.5 A – direct drive for 24VAC valves
2x 12VDC 70 mA – indirect drive for external 12VDC 120VAC relays
1x 3.3v AC sense interrupt line
3x 5v I/O lines programmable input or output
External 120VAC relays
Tnisesm 2PCS Power Relay DC12V Coil, 30A SPDT(1NO 1NC) 120 VAC with Flange Mounting and 10 Quick Connect Terminals Wires Mini Relay NT90-DC12V-10X
.. 70mA per coil .. 140mA x 12 VDC = 1.68W
Maximum power dissipation on LM340 without heatsink at 50C .. 2W
Other power dissipation guides: 10W enclosed, 20W vented with no heat sinks
Recommend no more than two (2) valves active simultaneously to limit dissipation in the enclosure that houses the PowerController. Pumps can be run simultaneously with valves due to low current draw.
Printed Circuit Board Design
Imported the schematic design to the KiCad PCB Editor and was quickly able to setup board dimensions, component layout and solder zones. Chose a two layer board to keep costs down, even though I chose to use a PCB manufacturer stateside. OSHPark is a great organization to work with that produces top quality boards. General design guidelines I followed include assigning hot or neutral to each of the two layers as well as north-south or east-west paths. Even following those guidelines I did need to use a small number of vias to route a path across a layer’s traces.
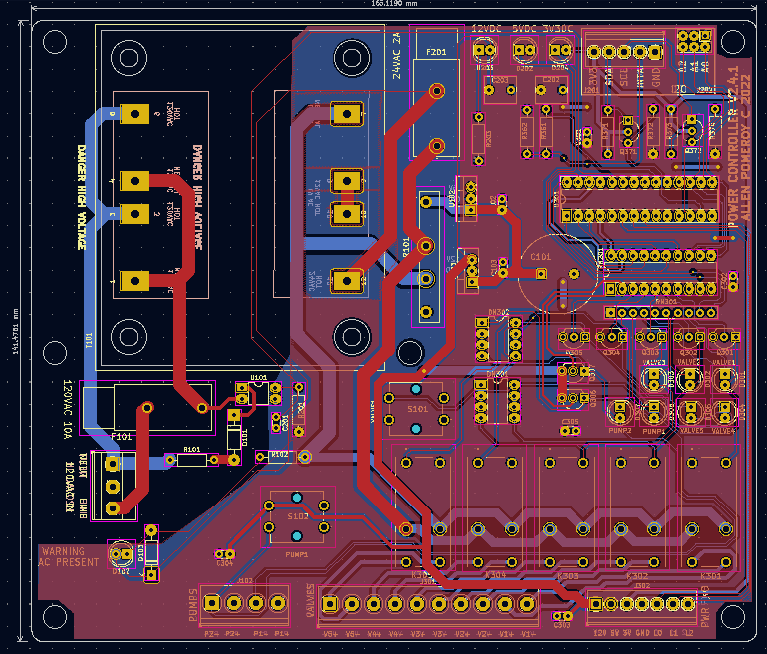
I heavily used the KiCad PCB Editor 3D view feature to help validate component placement on the circuit board. Most of the components were sources from Mouser Electronics, which has links to component symbols and footprints usable with most electronic design software (EDS) packages including KiCad. Where there wasn’t a component library available, typically you can request a part library be created. Samac will generate a zip file that contains symbol, footprint and even 3D model.
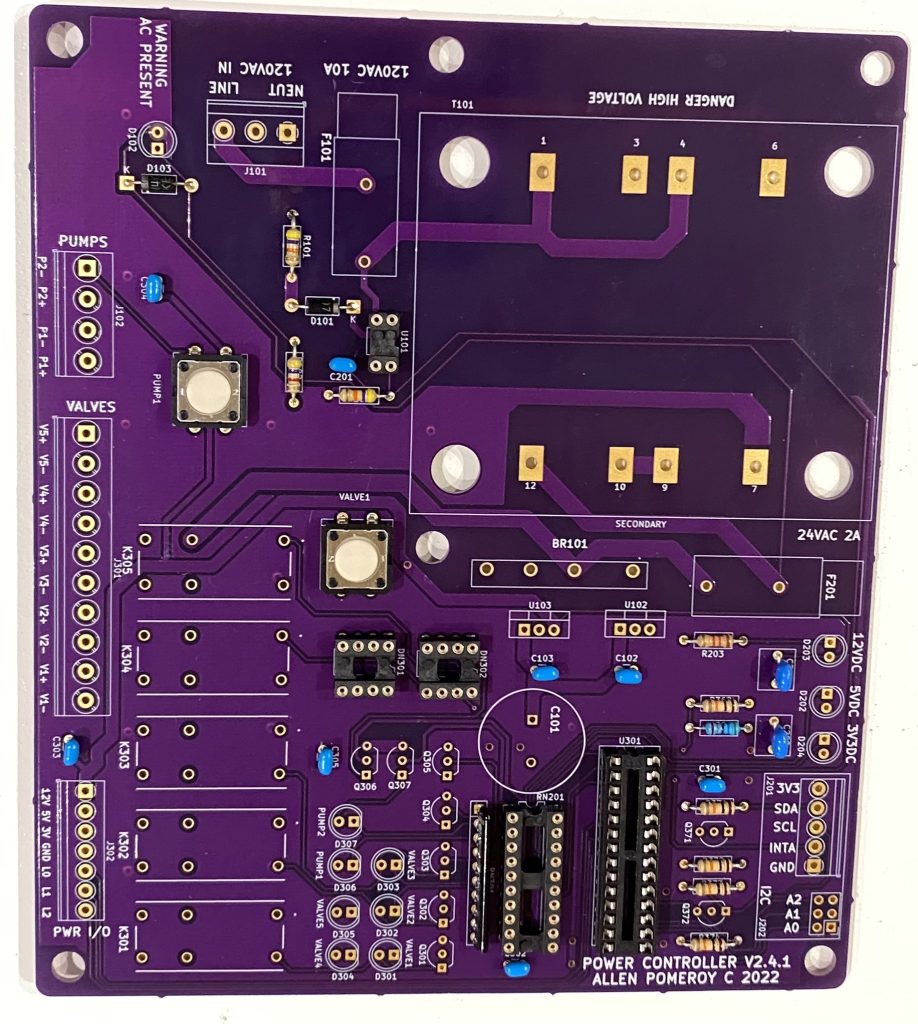
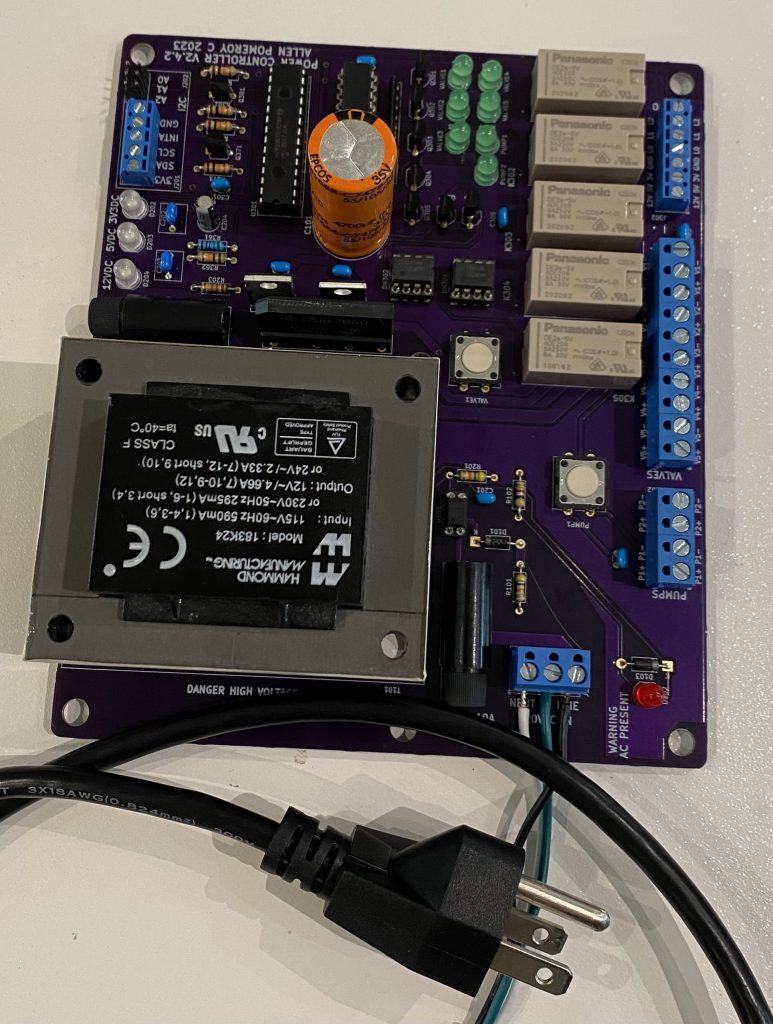
Assembly
Assembly of the board started with all the low profile components to make it easier to lay flat and hold the components in place while soldering.
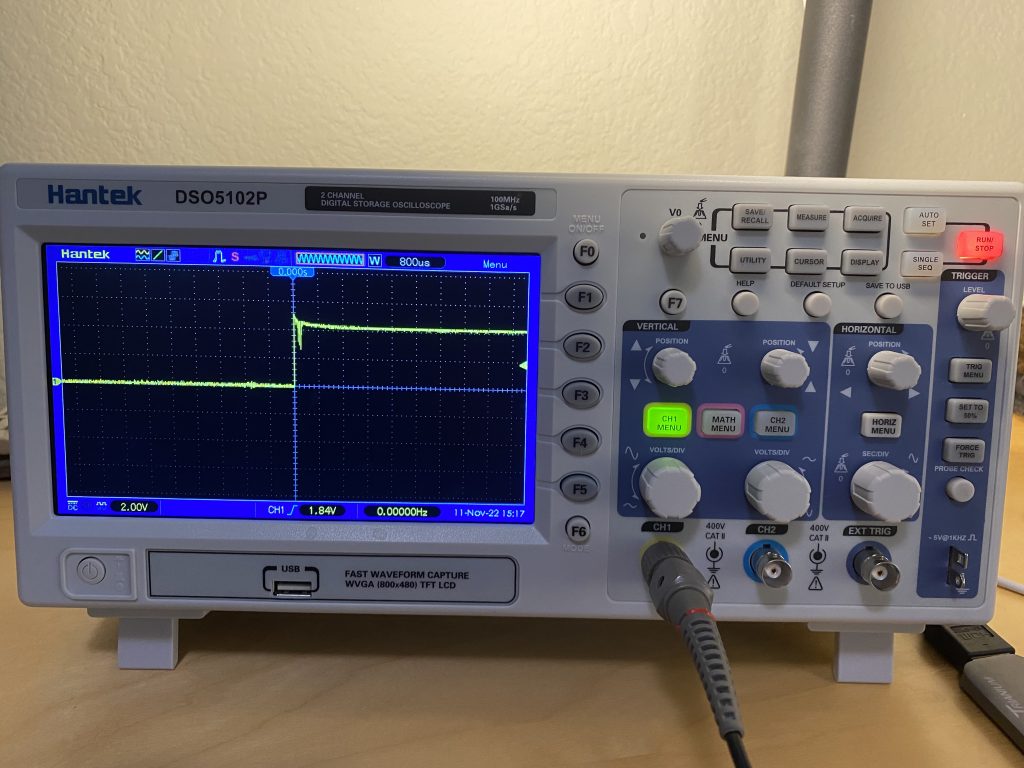
Testing
Once all the low power components were installed I ran some simple bench tests by feeding 3.3v and 5v to the power via the I/O block intended to provide power output once the board is completed. Only the passive components were plugged into their respective sockets so voltage tests and relay tests could be done.
Both Valve 1 and Pump 1 were successfully activated via the manual test buttons. Since there wasn’t any high voltage or on-board power yet, I determined the Valve 1 test was successful by running a resistance check from V1+ terminal screw to a 24VAC FUSED pad and V1- terminal screw to a LV NEUT pad. All the other terminal screws were open/off to both their respective 24VAC and LV NEUT feeds.
Pump 1 activated by push button successfully provided 12VDC to the Pump 1 screw terminals.
Active Component Testing
I removed all power and installed the MCP23017 IC then connected the 3V3, SDA, SCL and GND terminal block pins to the test Raspberry Pi. I also ran 5VDC from the Raspberry to the 5VDC I/O terminal block since the power supply components are not soldered in yet.
Powered on the Raspberry Pi and saw the 3V3 and 5V LEDs light up. Ran an i2cdetect to test connection to the PowerController:
i2cdetect -y 1

     0  1  2  3  4  5  6  7  8  9  a  b  c  d  e  f
00:          -- -- -- -- -- -- -- -- -- -- -- -- --
10: -- -- -- -- -- -- -- -- -- -- -- -- -- -- -- --
20: -- -- -- -- -- -- -- 27 -- -- -- -- -- -- -- --
30: -- -- -- -- -- -- -- -- -- -- -- -- -- -- -- --
40: -- -- -- -- -- -- -- -- -- -- -- -- -- -- -- --
50: -- -- -- -- -- -- -- -- -- -- -- -- -- -- -- --
60: -- -- -- -- -- -- -- -- -- -- -- -- -- -- -- --
70: -- -- -- -- -- -- -- 77
We can see the PowerController MCP23017 showing up at I2C address 0x27. We can also see a temperature and humidity sensor card at I2C address 0x77 on the same bus.
Power Controller Software
I chose to use the MCP23017 integrated GPIO controller due to the inclusive and compact hardware (simple single 20 pin DIP) and the extensive Python libraries available to simplify coding for status and control.
At github.com/allenpomeroy/PowerController I have developed a Python based control script powercontroller2.py
powercontroller2.py
–i2caddress: I2C address of the PowerController board, default 0x24
–testcount: Number of test cycles to run, default 3
–testontime: On time for tests (sec), default 1
–syslog: Send syslog status messages
–testofftime: Off time for tests (sec), default 1
–verbose: Print progress messages
–relay: [‘valve1’, ‘valve2’, ‘valve3’, ‘valve4’, ‘valve5’, ‘pump1’, ‘pump2’, ‘test’, ‘all’]
Name of relay to operate on
–action: [‘on’, ‘off’]
Action to perform on relay. Note relay ‘all’ can only accept action ‘off’
Update 2025/03/04
powercontroller2.py has been archived and you will now see two new scripts in the github.com/allenpomeroy/PowerController repository as I chose to split the controller code into a daemon that initializes the MCP and pin direction only once on startup. The client script (irrigation-controller.py) now only sends commands and listens for results on a socket, which avoids output relays unnecessarily being reset while simply looking for a state status.
While there is no limitation in the control script to prohibit multiple relays engaged at the same time, it is recommend to have no more than two (2) valves active simultaneously to limit heat dissipation in the enclosure that houses the PowerController. Both pumps can be run simultaneously with valves due to low current draw of the control relays.
Next software enhancement will be a webhook listener for the Raspberry Pi so applications have a clean interface to control the valves/pumps and get status. Think web based scheduling system or even iPhone / Android mobile app.
For any of the schematics, PCB manufacture or part lists feel free to email me powercontroller at pomeroy dot us.
My brother John and I have joined a group of fellow trekkers that are undertaking a charity trip to the Tsum Valley in Nepal.

Our friends at the Compassion Project have visited Nepal and the Tsum Valley many times and have written books on the wonderful people and locale. Coming to understand the challenges of training and retaining health care workers and teachers in the Tsum area resulted in our group deciding to not only do a spring 2022 trek through the Tsum Valley but also to raise funds to improve both health care and education opportunities. Lacking viable healthcare and education forces Tsum residents to travel to larger towns or even to Kathmandu. The travel is long, expensive and has long lasting negative effects on the Tsum community. We have an opportunity to provide substantial help and improve the conditions of these Tsum residents.
We are raising funding for two primary goals: Improve healthcare and also education opportunities for the Tsum Valley. Specifically, healthcare funds go to: (1) purchasing medicine and medical supplies, and (2) nurse’s salary. Education funds go to: (1) teacher’s salary, (2) school supplies, and most important (3) our hot lunch program where every student gets a healthy hot lunch at school. It is difficult for the Tsum valley to recruit and retain both healthcare workers and teachers due to the rural nature. This fundraising effort will encourage education of Tsum locals that wish to remain/return to Tsum, helping to improve the community.
We have setup a fund raising site on CanadaHelps to direct funds into the Compassion Project.
https://www.canadahelps.org/en/pages/nepal-trek-spring-2022/
| Annual Compassion Health Expenses USD | Annual Compassion Education Expenses USD | |||
| Services | ||||
| Staff (2x Health workers, 1x Office) | $9,525 | Teacher | $2,253 | |
| Medicine | $4,500 | Hot Lunch Program | $7,040 | |
| Office | $1,300 | 352/yr * 18 Students + staff | ||
| Transportation | $1,500 | Cook / Grounds Manager | $1,950 | |
| Monastery Care Taker | $4,150 | School Supplies | $1,000 | |
| $20,975 | $12,243 |


Fund raising goal: $8,000 Current funds raised: $2,850 ![]()

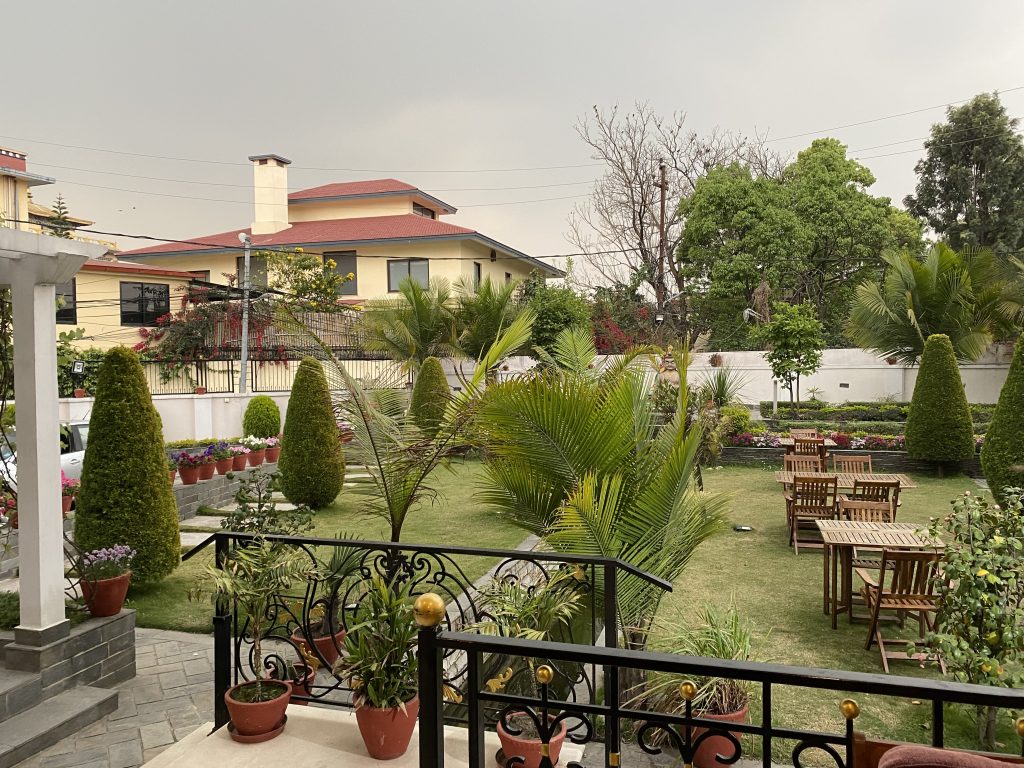
Tsum Valley is a sacred Tibetan Buddhist region and one of the hidden gems of Nepal. With the stunning backdrop of Sringi, Ganesh and Budda Himal mountain ranges, this serene valley is rich in ancient art, culture and religion. It is home to unique and important monasteries and trails are lined with artistic chortens and mani walls made of stone slabs inscribed with Buddhist prayers.


We tried very hard to stay up and awake until at least 9:30 so we could adjust and were moderately successful. Didn’t wake up until 2am then realized it was unexpectedly quiet and peaceful. No street noise, no crowds, no air conditioners. Turns out we were on the far side of the Stupa from main Kathmandu and surrounded by the monastery that also houses the local Kathmandu Llama so very peaceful. Helps when you can look on the Llamas residence from your hotel!
Hit a local Momo (local appetizer like a dumpling) cafe for a quick lunch bite before visiting the Durbar Square next to several temples and the Palace Museum.

The temples and the palace sustained significant damage in the 2015 earthquake and several countries have provided funding and technical expertise to help repair the damage to these ancient buildings. Damage to the ancient intricately carved wood columns is being done by carefully removing the damaged sections and replacing with pieces hand carved to match the original damaged parts.

The 31 hours of travel from Texas to Kathmandu was not as rough as I would have expected. Qatar Airlines was a refreshing experience even though I have used business class internationally before. Doha Hamad International Airport was spacious and modern. The lounge was a pleasant upgrade and made the six hour layover go quickly. After a chaotic but simple immigration process we were met by Tanzin and Tashi within the huge throng of arrivals, piled into the car and off into the morning Kathmandu traffic.
Hotel is close to the largest Stupa temple in Kathmandu. After walking around the Boudha Stupa we got a car to Patan to see the temples and palace. The traffic and skilled driver navigation and negotiation of massive traffic was almost as fun as seeing the temples. In the palace there was a display of a couple dozen pictures of the various valleys and the devastating impact of climate change.
https://www.cleverhiker.com/blog/nepal-backpacking-gear-checklist-teahouse-trekking
Quotes that I’ve collected:
In today’s global Internet connected and reliant IT environment, the issue of corporate networks becoming compromised is a fact. Defense in depth is still and important design pattern, but organizations with even relatively mature capabilities are relying on detection since prevention is simply not enough anymore. Whereas several years ago we used to speak about prevention of externally facing application attacks through coding flaws that lead to SQL Injection and buffer overflow attacks, now successful attackers have moved onto the weakest link: users. Compromise of user credentials now comprises 96% of the successful attacks on organizations. Why go through the brute force and difficult path of application compromised when the attackers can simply conduct a successful spear phishing attack on individuals in the organization?
This is where advanced detection comes in. User and Entity Behavior Analysis leads to high quality alerts regarding anomalous behavior that is exhibited by accounts where the user has been successfully compromised. Same detection capability exists for detecting users that are exceeding their authority, typically classed as Insider Threat – as well the machine learning can also detect systems (entities) that are behaving in a way that is antithetical to it’s normal behavior. Think of Point of Sale or healthcare Internet of Things devices that have been compromised and there aren’t specific user identities that can be used to profile normal behavior.
Of all these technologies that can be deployed, the foundation must be a sound information security program that puts policies, standards, guidelines and procedures in place that authorizes and supports the controls. The Security, Cyber, and IA Professionals (SCIAP.org) group have pulled together a concise document that outlines how to build an Effective Security Program.
Installation of HPE ArcSight Enterprise Security Manager (ESM) 6.9.1 on CentOS 7.1 is substantially easier with engineering adding a “pre-installation” setup script to this version. For a smooth installation, there are still a few steps we need to take .. outlined below.
yum install -y bind-utils pciutils tzdata zip unzipsystemctl disable firewalld; systemctl mask firewalldyum install -y ntpdate ntpsystemctl enable ntpd; systemctl start ntpd$ActionQueueFileName fwdRule1 # unique name prefix for spool files
$ActionQueueMaxDiskSpace 1g # 1gb space limit (use as much as possible)
$ActionQueueSaveOnShutdown on # save messages to disk on shutdown
$ActionQueueType LinkedList # run asynchronously
$ActionResumeRetryCount -1 # infinite retries if host is down
# remote host is: name/ip:port, e.g. 192.168.0.1:514, port optional
#*.* @@remote-host:514
*.* @10.10.10.5:514systemctl restart rsyslogyum install -y mailx tcpdumpcd Tools./prepare_system.sh./ArcSightESMSuite.binservice.session.timeout=28800server.search.timeout=28800/etc/init.d/arcsight_services stop/etc/init.d/arcsight_services startserver.staticbanner.textcolor=greenserver.staticbanner.backgroundcolor=blackserver.staticbanner.text=esm691/etc/init.d/arcsight_services stop manager/etc/init.d/arcsight_services start managerWelcome to the BlockSync Project
This project aims to provide an efficient way to provide mutual protection from deemed bad actors that attack Internet facing servers. The result will be an open source set of communication tools that use established protocols for high speed and light weight transmission of attacker information to a variable number of targets (unicasting to a possibly large number of hosts).
Background
There are many open source firewall technologies in widespread use, most based on either packet filter (pf) or netfilter (iptables). There is much technology that provides network clustering (for example, OpenBSD’s CARP and pfsync; netfilter; corosync and pacemaker), however it’s difficult for disparate (loosely coupled) servers to communicate the identity of attackers in real time to a trusted community of (tightly coupled) peers. Servers or firewalls that use state-table replication techniques, such as pfsync or netfilter, have a (near) real-time view of pass/block decisions other members have made. There needs to be a mechanism for loosely coupled servers to share block decisions in a similar fashion.
Our goal is to create an open source tool for those of us that have multiple Internet facing servers to crowd source information that will block attackers via the firewall technology of choice (OpenBSD/FreeBSD pf/pfSense, iptables, others).
Project Page
All project files are still private yet, but when we publish to GitHub or SourceForge, this section will be updated.
Funding
We have published a GoFundMe page to acquire more lab equipment here at gofundme.com/BlockSync
HP ArcSight Enterprise Security Manager (ESM) has some built-in capabilities to generate event files suitable for use with the ArcSight Test SmartConnector. These replay files can be used to test functioning of new ESM content (Dashboards, Datamonitors, Filters, Rules, Queries, Trends, Reports, etc). The Test connector has some very powerful features including the ability to replay the captured data as is, or to update the date/time stamp on each event to make the data appear as current versus historical data. The Test connector can also run multiple replay files into it’s configured destinations simultaneously and at a variable rate suitable to support initial content development as well as high speed, high volume performance testing.
Preparing to Generate Replay File
There are multiple ways to generate replay files, but in this post we will focus on use of the ESM console application software to generate the replay file from selected events already existing in the ESM instance. In order to constrain the events to a selected subset, we need to have a filter prepared to chose the appropriate events.


For this example, a filter named router4 will be used, where it simply selects all events that have been generated by device name router4 or device address 10.20.1.27
Generating the Replay File
On the workstation or system where the ESM Console software is installed, start the replay file generator with a replayfilegen argument to the arcsight script in the bin directory. If the console is installed on Linux or Mac OS X, simply use ./arcsight replayfilegen as the command.
![]()
When the replayfilegen tool starts, it will display a GUI that allows the user to select the target filename to be generated, the timeframe to query and the filter to select the event data.

Note that a relative time frame may be specified by using relative start and end time operators – these will calculate the absolute time frames needed.

Once the collection has started, there will be a progress display showing the generation of the replay file.

Deploying and Using the Replay File
Now the replay file has been generated, the user can simply copy the file to the current directory of the Test SmartConnector. There can be multiple replay files in the current directory and all will be displayed when the Test connector GUI starts.
![]()
The user can select which replay files are to be read and events forwarded to the Test connector destinations. Any or all of the replay files may be selected, making the Test connector ideal for assisting in content development for multiple use cases.

Once the desired replay files are selected, the events will be replayed to the configured destinations at the rate specified by the user, as soon as the Continue button is pressed.

The Test connector will run through all the event data in each selected replay file and stop. By default there will only be one pass through the data files and no event data is altered. ESM Manager Receipt Time will show the current date/time however the original timestamps will be present in the event data. The event rate can be changed dynamically while the replay is in progress, so for example, some basic event data could be played to the destinations for some time then the user could adjust the event rate substantially higher to speed the event ingest to the destinations. This is useful for testing use cases where there may be denial of service or worm outbreak detection that is sensitive to event rates.
There are many run-time options that can be set for the Test Connector, including the ability to loop on the replay files, replay the event data with current time stamps and other event handling options.